I originally wrote this with my colleague, Bethany Chalmers, as a possible article for Teaching in the Middle magazine. But after reading Dan Meyer’s blog about the kinetic energy of blog posts over printed articles, I thought I would throw it on my blog. It’s a summary of what we learned from a semester of tying pattern talks to linearity in an 8th grade Algebra 1 classroom.
Why pattern talks?
“Slope isn’t just a number; it’s a unit rate of change.” “No, not change in x divided by change in y; it’s the other way around.” “No, you can’t just divide a y-value by an x-value; it has to be the change in y and the change in x.” “Okay, now how can you use the slope to find the y-intercept?”
These are the comments and questions we continuously find ourselves repeating seemingly to no avail as we push students towards the explicit, non-tabular reasoning necessary to write linear equations. Every year students grab onto the tabular recursive understanding of linearity with ease but then get lost in the formulas and procedures of calculating slope and y-intercept. Slope becomes just the answer to a formula and the y-intercept some abstract concept that only the “smart” kids can figure out. In an attempt to bridge students’ misconceptions with their understandings, we started making pattern talks a regular part of our math lessons.
Goals for our talks
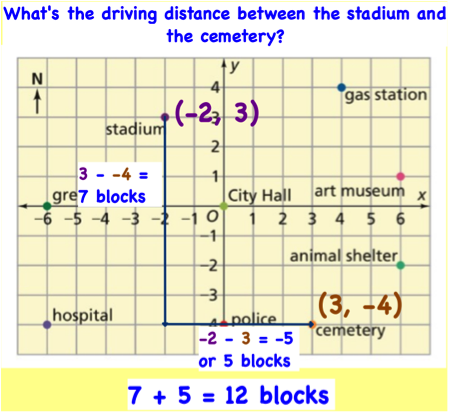
After doing some reflecting and researching on our students’ common misconceptions about slope and y-intercept, we embarked on this math talk adventure, with two main premises in mind. First, students need a quantity intervention. Too many students saw slope as a difference instead of a ratio. In fact, when discussing similarities between calculating driving distances on a grid and slope during Connected Mathematics’ Looking for Pythagoras unit, students insisted that the driving distance of 12 was the slope (Figure 1). Even with substantial questioning and examples on our part, we could not get our students to budge from slope as a difference. According to researchers Lobato, Ellis, and Munoz, when students examine linear patterns with a recursive understanding, they see quantities independent of each other. As a result students tend to see slope as a difference instead of a ratio. Furthermore, the three researchers assert that while a recursive understanding is a necessary building block, teachers need to intervene to make sure students make the explicit connection needed to write formal linear equations (2003). Once students have seen tables and formulas, they need to have their attention drawn back to co-varying quantities and units (Elliis, 2009). Pattern talks were our attempt at a quantity intervention.
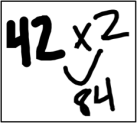
| Figure 1: The misconception of slope as a difference.
|
Second, we needed students to attend to structure and the similarities between different strategies. Although writing the explicit linear equation was our ultimate goal, this could not be the focus of our talks. Boaler and Humphreys (2005) found that when finding the explicit equation was the goal, students (and teachers) lost sight of the underlying mathematics. They note, how it is “…less important that students be able to find the algebraic rule than that they recognize that the different visualizations of a pattern can be described symbolically in equivalent algebraic expressions.” For this reason, we were intentional about how we wrote student responses on the board so students could make connections between strategies, the picture, slope and y-intercept.
Structuring our talks
Before we were ready to start orchestrating talks in our classroom, we spent time planning how we wanted to structure the talks. We used Sherry Parrish’s “Five Small Steps Toward Teaching for Understanding” (2010) as a guide in this planning phase. She encourages teachers to:
- start with a smaller problem;
- be prepared with a strategy from a “previous student;”
- be okay with putting a student’s strategy on the back burner;
- limit talks to five to fifteen minutes;
- be patient with yourself and your students (as you learn how to effectively orchestrate talks into your everyday classroom).
We decided to implement math talks into our warm-up routine, with students analyzing a figure or visual pattern about once per week. Many of the figures and patterns we used came from Fawn Nguyen’s websites, Visual Patterns and Math Talks. We showed students a figure or visual pattern with an accompanying question or questions (Figure 2). We gave students 3 or 4 minutes of quiet think time to develop an answer to the question. In the beginning, we had students do this thinking without writing, to encourage reliance on mental picturing in finding their answers. Later we encouraged them to draw figures and write down calculations or expressions to arrive at an answer. When students arrived at an answer to the question, we asked them to show us a thumbs up in front of their body. This subtle indication of being ready let us know when the majority of students were ready to start the discussion and didn’t put undue pressure on students who were still thinking. When the majority of students showed a thumbs up, we moved on to the selecting and sequencing phases and started the discussion as a class.
We decided that we would ask for answers only first and then student reasoning. We started the discussion by calling for answers only. We recorded all answers on the board with no indication of whether it was right or wrong. After we exhausted the different student answers, we solicited strategies by asking, “Is there anyone willing to defend their answer?” As the student spoke, we thoughtfully recorded their thinking at the board. Once a student finished explaining, we opened it up to the class by asking, “Are you convinced by this thinking? Does anyone have a monster to throw at this strategy?” We define a monster as any part of the thinking that didn’t make sense. If students seemed satisfied, we would call for any other strategies, recording each strategy on the board and labeling the strategy with the student’s name.
As teachers we guided the discussion towards our two goals of a quantity intervention and multiple representations. With that in mind, we had three main tasks. One, to record student thinking so that students could begin to make connections between their mental pictures and the accompanying algebraic structure. Two, to orchestrate a discussion where students were questioning, defending, and making connections between different students’ strategies. Lastly, to hold students accountable to the content of our talks by ending each talk with a connection or extension phase.
Pattern Talks: The 5 Practices in Action
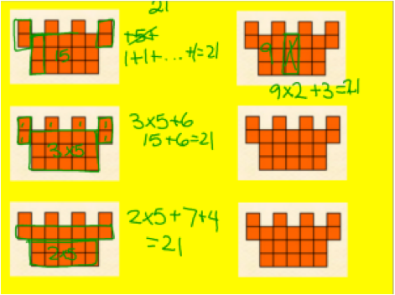
Once we knew how we wanted the talks to play out in our classroom, we had to decide how to scaffold the talks to achieve our two main goals of a quantity intervention and multiple representations. We decided students needed to understand representations and structure before they would be able to reason more deeply with quantities. Following Parrish’s advice of starting with a smaller problem, we began with what we called a “figure talk.” Our goal here was merely to get students to start picturing mentally and seeing different representations of solving the same problem.
| Figure 2: Figure Talk
Students were shown this question:
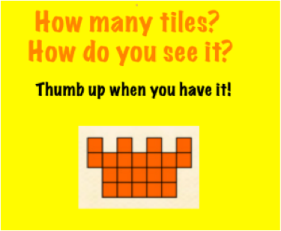
In choosing this figure, we spent time anticipating different solution strategies and how we would represent these strategies on the board. The arithmetic number sentences shown below were a conscious choice on our behalf since structure was a big part of getting students to write explicit equations.
|
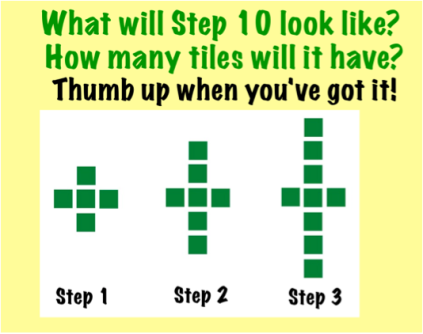
Continuing our focus on structure and representation (with explicit rules for patterns as our eventual goal), we knew it was important for students to get in the habit of looking for structure in a figure. Before asking our students to extend a pattern or write a rule, we simply asked them to to describe what they saw. We gave them a figure like the one shown in Figure 3 and asked the question, “What makes this a step 2 figure?”
| Figure 3: What makes this a step 2 figure?

Student Responses:
Student 1: “This is a step 2 figure because it has 2 archways.”
Student 2: “This is a step 2 figure because it has 2 breadsticks on the top level.” |
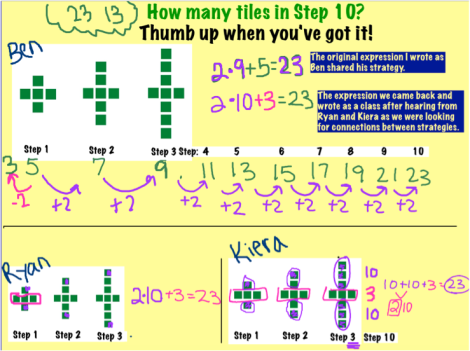
In simply looking for what made a figure a “step 2 figure,” students looked for structural elements and then generalized to a larger step number. We then asked, “What would a step 10 figure look like?” Students were able to use the structural elements they identified in the step 2 figure to predict the number of breadsticks in the step 10 figure (Figure 4).
| Figure 4: How many breadsticks are in step 10?
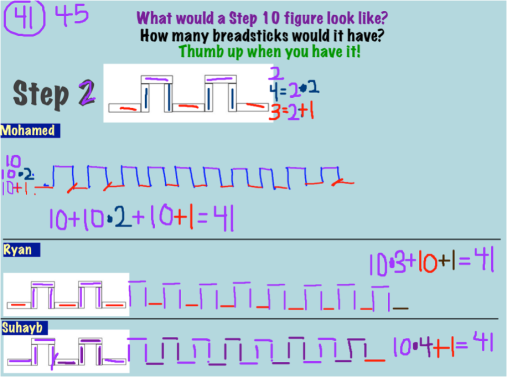
Mohamed’s response to Suhayb’s simplistic strategy of 10 groups of 4 plus one more, “Whoa, that’s so cool!” |
Now that our students were familiar with structure and representation, we needed to start to push the quantity intervention by connecting recursive thinking to explicit thinking. We began by showing students consecutive steps of a pattern and asked them to predict for a later step. Seeing consecutive steps, led some students to think recursively, while other students still made predictions based on an explicit expression. When both types of thinking came out in our class discussion, we were able to help students see the connection between the two (Figure 5).
| Figure 5: Recursive and Explicit Thinking
 The choice of color and structure used to write each expression was very intentional on our part as the teacher. During the anticipation phase of planning this talk, we came up with an exhaustive list of strategies and planned what and how we would write each strategy on the board. We wanted to connect parts of the expression to the picture while also encouraging the linear structure y=mx+b. The choice of color and structure used to write each expression was very intentional on our part as the teacher. During the anticipation phase of planning this talk, we came up with an exhaustive list of strategies and planned what and how we would write each strategy on the board. We wanted to connect parts of the expression to the picture while also encouraging the linear structure y=mx+b.
To extend our students thinking and hold them accountable for explicit thinking, we followed up this number talk with a Pear Deck that asked students, “How would Ryan find the number of tiles in step 42?
95% of student responses used the structure xm+b=y:

One student used the structure b+mx=y:
Only one student reasoned incorrectly by forgetting the starting three tiles:
|
After spending a couple of weeks doing pattern talks with consecutive steps, we knew it was time to really push the quantity intervention. We needed to force students to have to reason with slope as a ratio and not just consecutive sums or differences. In our next set of pattern talks, we gave students non-consecutive values of the independent variable to begin to necessitate this understanding of slope as a ratio of two quantities changing together (Figure 6).
| Figure 6: Encouraging Explicit Thinking
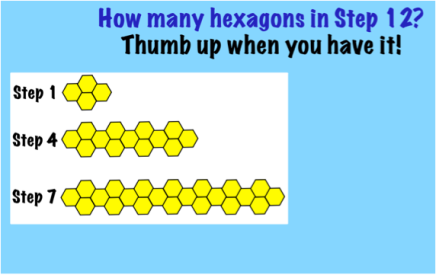
The resulting responses and discussion were everything we could have hoped for as a teacher.
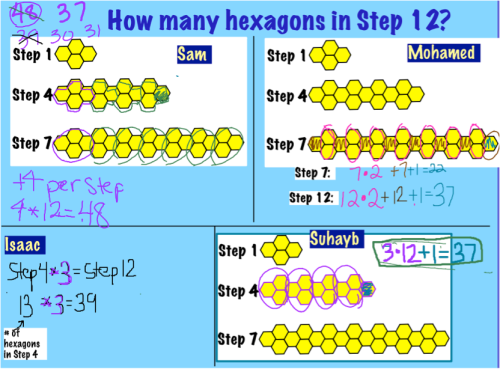
This question resulted in five different student answers. Sam raised his hand first to defend his answer of 48 hexagons. (This alone showed students found these pattern talks to be a safe space for sharing and thinking as Sam is extremely shy and hesitant about his math capabilities.) Another student quickly threw a monster at his strategy.
Student: “At first I thought the rate of change was 4, too, but then I realized that only step 1 had four and then there were groups of 3, so I think it’s going up by 3.”
I circled the four hexagons at the beginning and then prompted the student to be more specific with her language.
Teacher: “What do you mean by going up by 3?
Student: Like every time you go up a step, you add 3 hexagons.
I circled the groups of three. This was sufficient for us to agree as a class that 48 did not make sense.
Isaac defended 39 next. He reasoned proportionally. Reasoning proportionally makes so much sense to students. Pictures were especially helpful in getting students to see the errors in this reasoning. Suhayb threw the first monster by showing Isaac that his strategy overcounts the hexagons.
Suhayb: In step four, there are four groups of three plus one more, so in step twelve there will be twelve groups of three, not thirteen. Then you have to add the one hexagon at the end for a total of 37.
Mohamed then said he agreed with Suhayb because using his method, he also counted 37 hexagons. With the connection between the numbers and pattern clearly visible, students came to the consensus that there were 37 hexagons in step twelve.
|
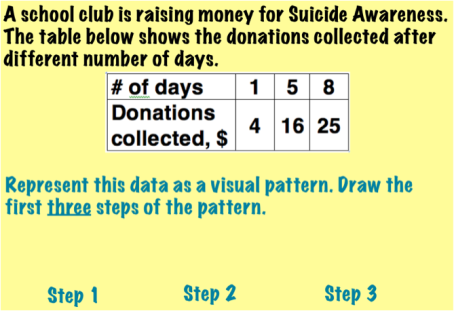
The last phase of our pattern talks needed to bridge students’ linear reasoning with a visual pattern to standard equation-writing situations from graphs, tables or coordinate pairs. In some of our later talks, like the hexagon one, we made sure to explicitly define the independent and dependent variables, slope, and y-intercept. This was important because in our last phase, the task was reversed. Students had to create visual patterns to align with a tabular representation of a linear relationship. We did this first by giving students a table showing consecutive values of the independent variable. Creating a visual pattern with the correct rate of change was easy for most students, while creating a pattern with a clear and meaningful y-intercept was more of a challenge (Figure 7).
| Figure 7: Creating a visual pattern from a consecutive table.

Xavier’s pattern produces the correct values for the dependent variable and shows the correct rate of change, 2. The y-intercept, however, is not clearly shown in the visual pattern. The step 2 figure has more of a “step 3” quality due to the 3 groups of 2 circles.

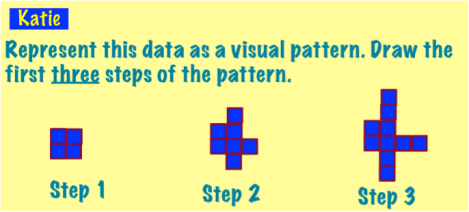
Katie’s visual pattern is a stronger representation of the information from the table, as both the rate of change and y-intercept are clearly represented in the figures. The step 2 figure has a “step 2 likeness” with 3 circles to start and 2 additional groups of 2. |
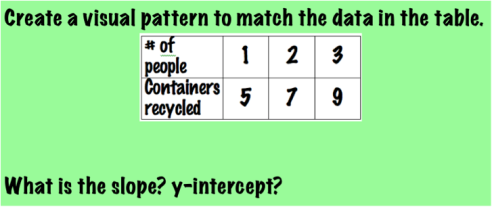
As we knew before we embarked on this journey, students grasp rate of change with some ease when it is simply a consecutive sum or difference. To push them further, we gave students a nonconsecutive tabular representation to model with a visual pattern (Figure 8). We found that students did not have much difficulty identifying the rate of change for the table and embedding it into their visual patterns. This was great to see, as we have seen students struggle so much in the past with finding rate of change when given nonconsecutive coordinate pairs.
| Figure 8: Creating a visual pattern from a nonconsecutive table.
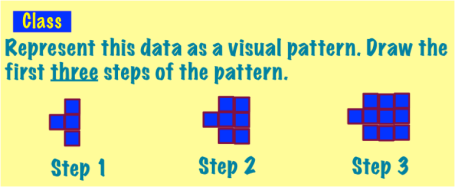
As we reflected on Katie’s pattern as a class, students agreed that this pattern had the correct rate of change, 3, as well as the correct number of squares in step 1. One student expressed confusion over why the added squares for each step were place in the manner that they were. Katie wasn’t able to defend her reasoning and agreed that the squares could have been placed in a different manner. When asked how the y-intercept was represented in this visual pattern, students agreed that it wasn’t clearly represented. As a class, we modified the visual pattern to the version shown below. The y-intercept of 1 is clearly shown in the leftmost square, and the rate of change of 3 is shown in the new column of 3 squares added to each step.
|
Going further
With visual patterns, students never reasoned ,𝑐ℎ𝑎𝑛𝑔𝑒 𝑖𝑛 𝑥–𝑐ℎ𝑎𝑛𝑔𝑒 𝑖𝑛 𝑦.. It intuitively doesn’t make any sense. To strengthen students understanding of slope as a ratio, we encourage teachers to continue to build the bridge from visual pattern to linear situation by providing more situations like Figures 7 and 8, translating graphs, tables and situations into visual patterns. If students equated every linear situation to a visual pattern, by thinking of the dependent variable as “number of squares” and the independent variable as “step number,” students would be able to calculate slope and attach meaning to it.
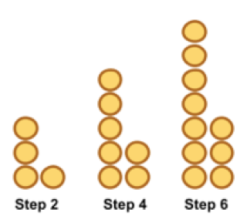
To strengthen the ratio concept, we also encourage teachers to experiment with non-integer rates of change. For example, giving students a pattern like the one shown in Figure 9, where number of pizzas increases by three for every two steps.
| Figure 9: Non-integer slope
|
We also encourage teachers to make visual patterns a regular part of their classroom routine. Students need immediate opportunities to use the strategies and thinking from a pattern talk before they forget.
Overall, we were pleased with the progress our students made around representing visual patterns with structure and beginning to see slope as ratio of two varying quantities. Students became comfortable with the routine of pattern talks and liked seeing their classmates strategies.
Resources:
Boaler, J., & Humphreys, C. (2005). Connecting mathematical ideas: Middle school video cases to support teaching and learning. Portsmouth, NH: Heinemann.
Ellis, A. (2009). Patterns, Quantities, and Linear Functions. Mathematics Teaching in the Middle School, 14(8), 482-491.
Lobato, Joanne, Ellis, Amy Burns and Munoz, Ricardo (2003). How “Focusing Phenomena” in the Instructional Environment Support Individual Students’ Generalizations. Mathematical Thinking and Learning, 5:1, 1 – 36.
Nguyen, Fawn. Math Talks. Retrieved from http://www.mathtalks.net/pt-1-4.html
Parrish, S. (2010). Number talks: Helping children build mental math and computation strategies, grades K-5. Sausalito, CA: Math Solutions.
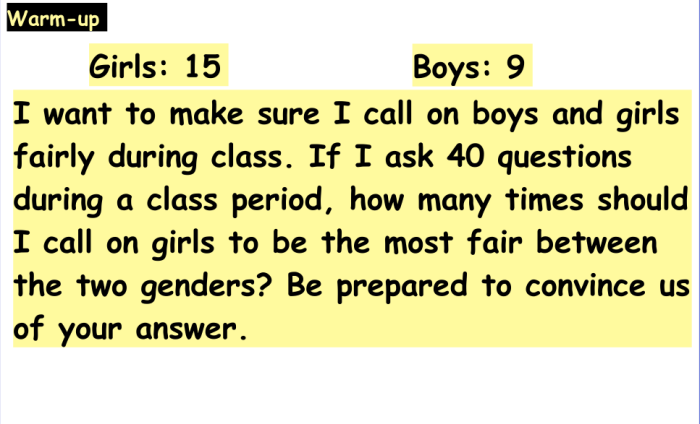 Some students were hell-bent on 20/20. Other students had a gut-feeling that this wasn’t fair because there were more girls. Students who found unit rates (questions per gender) were finally able to shed some viable proof on why the 20/20 plan wasn’t fair. They were using math to construct arguments and their arguments were grounded in the concept of proportionality. My only regret, this question came at the end of the unit. I need to give them more questions like this throughout the unit that make them wrestle with fairness by using their proportional reasoning strategies.